Tabla I. Características demográficas y gravedad. |
||||||||
Patología |
Características demográficas |
Tiempo en UCI y monitorización (días) |
Gravedad |
Fármacos d |
||||
Paciente |
Sexo |
Edad |
Total |
Previo c |
Monitorización |
|||
HSA a (V) |
A |
M |
53 |
41 |
2 |
6 |
4-8/sedado |
Fentanilo, midazolam, propofol, levetiracetam, ácido valproico, tiopental, nimodipino |
HSA a (IV) |
B |
M |
26 |
41 |
3 |
4 |
4-8/sedado |
Fentanilo, midazolam, propofol, levetiracetam, nimodipino |
HSA a (V) |
C |
M |
55 |
39 |
2 |
8 |
4-8/sedado |
Fentanilo, midazolam, propofol, fenitoína, levetiracetam, nimodipino |
HSA a (III) |
D |
M |
76 |
10 |
2 |
6 |
13-15/sedado |
Fentanilo, midazolam, propofol, ácido valproico, lacosamida, nimodipino |
HSA a (III) |
E |
M |
65 |
39 |
3 |
4 |
9-12/sedado |
Fentanilo, midazolam, propofol, nimodipino |
HSA a (IV) |
F |
M |
50 |
24 |
5 |
5 |
9-12/4-8 |
Fentanilo, midazolam, propofol, levetiracetam, nimodipino |
TCE |
G |
H |
37 |
20 |
4 |
7 |
4-8/sedado |
Fentanilo, midazolam, propofol, levetiracetam, fenitoína |
TCE |
H |
H |
31 |
24 |
1 |
3 |
4-8/4-8 |
Fentanilo, midazolam, propofol, levetiracetam |
TCE |
I |
M |
54 |
16 |
1 |
6 |
4-8/4-8 |
Fentanilo, midazolam, propofol, levetiracetam |
TCE |
J |
H |
47 |
25 |
3 |
7 |
9-12/sedado |
Fentanilo, midazolam, propofol, levetiracetam, cloracepam, tiopental |
TCE |
K |
H |
58 |
19 |
2 |
3 |
13-15/sedado |
Fentanilo, midazolam, propofol, levetiracetam |
TCE |
L |
H |
63 |
15 |
1 |
5 |
4-8/sedado |
Fentanilo, propofol |
TCE |
M |
H |
20 |
24 |
2 |
4 |
4-8/sedado |
Fentanilo, midazolam, propofol, cloracepam |
TCE |
N |
M |
71 |
41 |
1 |
4 |
3/sedado |
Fentanilo, midazolam, propofol, levetiracetam, fenitoína |
TCE |
O |
H |
81 |
7 |
2 |
3 |
13-15/sedado |
Fentanilo, midazolam, propofol, levetiracetam, ácido valproico, nicardipino |
TCE |
P |
H |
28 |
14 |
2 |
4 |
13-15/sedado |
Fentanilo, propofol, ácido valproico, cloracepato, nicardipino |
TCE |
Q |
H |
22 |
27 |
2 |
4 |
4-8/sedado |
Fentanilo, midazolam, propofol, levetiracetam, dexmedetomidina, haloperidol, nicardipino |
TCE |
R |
H |
68 |
28 |
4 |
7 |
9-12/sedado |
Fentanilo, midazolam, propofol, levetiracetam, ácido valproico, cisatracurio, clorpromacina, cloracepato, nicardipino |
TCE |
S |
M |
56 |
25 |
3 |
8 |
9/sedado |
Fentanilo, midazolam, propofol, levetiracetam, ácido valproico, rocuronio, nicardipino |
TCE |
T |
H |
48 |
36 |
9 |
7 |
9/sedado |
Fentanilo, midazolam, propofol, levetiracetam, ácido valproico |
TCE |
U |
M |
75 |
42 |
3 |
9 |
9/sedado |
Fentanilo, midazolam, propofol, valproato |
HSA: hemorragia subaracnoidea; TCE: traumatismo craneoencefálico; UCI: unidad de cuidados intensivos. a Se incluye la escala de Hunt-Hess al diagnóstico; b Corresponde en el diagnóstico y a los tres días (diagnóstico/tercer día); c Hace referencia a los días desde el diagnóstico hasta la monitorización de la presión intracraneal con almacenamiento de los datos; d Corresponden a los recibidos durante la monitorización (perfusión o bolos). |
Figura 1. Paciente I. Series temporales correspondientes a la monitorización continua de distintas medidas del electroencefalograma, la presión intracraneal y la frecuencia cardíaca durante aproximadamente 48 horas. Las unidades en varias de las medidas son arbitrarias (a.u.).
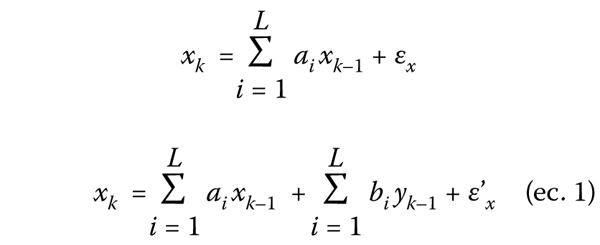
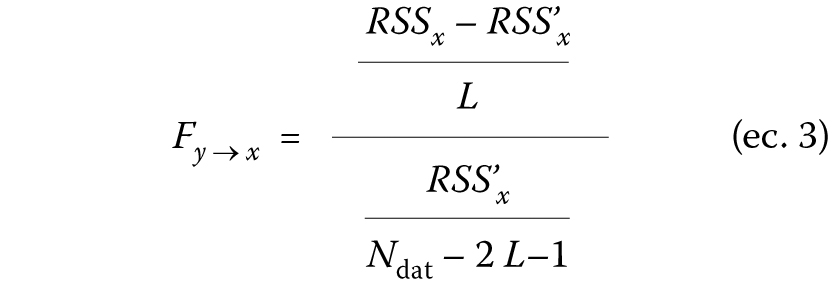
Figura 2. Paciente I. Cálculo de la causalidad de Granger entre distintos pares de variables a lo largo de aproximadamente 48 horas. Para cada par de variables (ordenadas), considerando la causalidad directa y la inversa, se calcula la causalidad de Granger (ecuación 2) y su significación (ecuación 3), pintando solamente (de acuerdo con la escala de la derecha) los valores de la ecuación 2 significativos (p < 5%). Los valores mayores de 5 se han igualado a 5 para una mejor visualización. El recuadro sombreado en las ordenadas señala las variables en la dirección del electroencefalograma hacia la presión intracraneal.
Figura 3. Paciente I. Tiempo de máxima correlación cruzada entre cada par de variables en cada ventana temporal de 10 minutos a lo largo de aproximadamente 48 horas.
Tabla II. Porcentajes de causalidad de Granger significativa para distintas variables de un paciente: las columnas describen el porcentaje de tiempo en relación con el tiempo total de monitorización, en que la causalidad de Granger es significativa (paciente I). |
|||
L = 5 |
L = 10 |
L = 15 |
|
EE → PIC |
56,07 |
48,21 |
37,86 |
rAlfa → PIC |
60,36 |
56,43 |
43,21 |
rDelta → PIC |
59,64 |
54,64 |
42,86 |
rTheta → PIC |
42,50 |
40,00 |
28,57 |
PIC → EE |
4,64 |
2,86 |
1,79 |
PIC → rTheta |
3,57 |
1,07 |
1,79 |
PIC → rAlfa |
3,21 |
2,50 |
1,79 |
PIC → rDelta |
4,29 |
2,50 |
1,07 |
EE: entropía espectral; PIC: presión intracraneal. |
Figura 4. Porcentaje de tiempo en el que la causalidad de Granger (CG) es significativa para los distintos pares de variables, en cada paciente, durante su monitorización en la unidad de cuidados intensivos. Para una mejor visualización se ha eliminado la variable rTheta.
Tabla III. Porcentajes de causalidad de Granger significativa para distintas variables de pacientes con hemorragia subaracnoidea (HSA) y traumatismo craneoencefálico (TCE). Las columnas describen el porcentaje de tiempo, en relación con el tiempo total de monitorización, en que la causalidad de Granger es significativa (valor de L = 10). |
||
HSA |
TCE |
|
EE → PIC |
23,43 |
26,89 |
rAlfa → PIC |
35,18 |
32,48 |
rDelta → PIC |
32,67 |
31,35 |
rTheta → PIC |
29,50 |
24,88 |
PIC → EE |
4,00 |
5,58 |
PIC → rTheta |
4,84 |
4,95 |
PIC → rAlfa |
4,68 |
5,22 |
PIC → rDelta |
5,50 |
5,55 |
EE: entropía espectral; PIC: presión intracraneal. |
Is it possible to extract intracranial pressure information based on the EEG activity? Introduction. The capability of the electroencephalography (EEG) of recording the bioelectrical activity of the brain has made of it a fundamental tool for the evaluation of the patient’s neurological condition. In recent years, moreover, it has also begun to be used in obtaining information for other kind of variables, as the ones related with the cerebral hemodynamics. Aim. To study the potential relationship between the EEG activity and the intracranial pressure (ICP) in patients suffering from traumatic brain injury and subarachnoid hemorrhage, during their stay at the intensive care unit. Patients and methods. Twenty-one adult patients (10 women) were included in the present observational prospective cohort study. They suffered from either traumatic brain injury or subarachnoid hemorrhage, requiring continuous EEG and ICP monitoring. In every patient, Granger causality between spectral functions of the EEG and the ICP was evaluated. Temporal windows of 10 minute were used to evaluate whether a causal relationship between those variables exist or not. In all of the cases, several days of continuous recording and assessment were performed. Results. In most patients and during most of the time, Granger causality turns out to be significant in the direction from the EEG to the ICP, meaning that the EEG dynamics actually leads the ICP dynamics. Conclusions. The present work provides useful information and shed light in discovering a hidden relationship between the ICP and EEG dynamics. The potential use of this relationship could lead to develop a medical device to measure ICP in a non-invasive fashion. Key words. Electroencephalography. Granger causality. Intracranial pressure. Subarachnoid hemorrhage. Traumatic brain injury. |